The Big Picture: GOES-R and the Advanced Baseline Imager
By Kieran Mulvaney
The ability to watch the development of storm systems ideally in real time, or as close as possible has been an invaluable benefit of the Geostationary Operational Environmental Satellites (GOES) system, now entering its fortieth year in service. But it has sometimes come with a trade-off: when the equipment on the satellite is focused on such storms, it isnt always able to monitor weather elsewhere.
Right now, we have this kind of conflict, explains Tim Schmit of NOAAs National Environmental Satellite, Data, and Information Service (NESDIS). Should we look at the broad scale, or look at the storm scale? That should change with the upcoming launch of the first of the latest generation of GOES satellites, dubbed the GOES-R series, which will carry aloft a piece of equipment called the Advanced Baseline Imager (ABI).
According to Schmit, who has been working on its development since 1999, the ABI will provide images more frequently, at greater resolution and across more spectral bands (16, compared to five on existing GOES satellites). Perhaps most excitingly, it will also allow simultaneous scanning of both the broader view and not one but two concurrent storm systems or other small-scale patterns, such as wildfires, over areas of 1000km x 1000km.
Although the spatial resolution will not be any greater in the smaller areas than in the wider field of view, the significantly greater temporal resolution on the smaller scale (providing one image a minute) will allow meteorologists to see weather events unfold almost as if they were watching a movie.
So, for example, the ABI could be pointed at an area of Oklahoma where conditions seem primed for the formation of tornadoes. And now you start getting one-minute data, so you can see small-scale clouds form, the convergence and growth, says Schmit.
In August, Schmit and colleagues enjoyed a brief taste of how that might look when they turned on the GOES-14 satellite, which serves as an orbiting backup for the existing generation of satellites.
We were allowed to do some experimental imaging with this one-minute imagery, Schmit explains. So we were able to simulate the temporal component of what we will get with ABI when its launched.
The result was some imagery of cloud formation that, while not of the same resolution as the upcoming ABI images, unfolded on the same time scale. You can compare the difference between it and the existing GOES-13 imagery here:http://cimss.ssec.wisc.edu/goes/blog/wp-content/uploads/2013/08/GOES1314_VIS_21AUG2013loop.gif.
Learn more about the GOES-R series of satellites here: http://www.goes-r.gov.
Kids should be sure to check out a new online game thats all about ABI! Its as exciting as it is educational. Check it out at http://scijinks.gov/abi.
This article was provided by the Jet Propulsion Laboratory, California Institute of Technology, under a contract with the National Aeronautics and Space Administration.
The Advanced Baseline Imager. Credit: NOAA/NASA.
The Most Volcanically Active Place Is Out-Of-This-World!
By Dr. Ethan Siegel
Volcanoes are some of the most powerful and destructive natural phenomena, yet they're a vital part of shaping the planetary landscape of worlds small and large. Here on Earth, the largest of the rocky bodies in our Solar System, there's a tremendous source of heat coming from our planet's interior, from a mix of gravitational contraction and heavy, radioactive elements decaying. Our planet consistently outputs a tremendous amount of energy from this process, nearly three times the global power production from all sources of fuel. Because the surface-area-to-mass ratio of our planet (like all large rocky worlds) is small, that energy has a hard time escaping, building-up and releasing sporadically in catastrophic events: volcanoes and earthquakes!
Yet volcanoes occur on worlds that you might never expect, like the tiny moon Io, orbiting Jupiter. With just 1.5% the mass of Earth despite being more than one quarter of the Earth's diameter, Io seems like an unlikely candidate for volcanoes, as 4.5 billion years is more than enough time for it to have cooled and become stable. Yet Io is anything but stable, as an abundance of volcanic eruptions were predicted before we ever got a chance to view it up close. When the Voyager 1 spacecraft visited, it found no impact craters on Io, but instead hundreds of volcanic calderas, including actual eruptions with plumes 300 kilometers high! Subsequently, Voyager 2, Galileo, and a myriad of telescope observations found that these eruptions change rapidly on Io's surface.
Where does the energy for all this come from? From the combined tidal forces exerted by Jupiter and the outer Jovian moons. On Earth, the gravity from the Sun and Moon causes the ocean tides to raise-and-lower by one-to-two meters, on average, far too small to cause any heating. Io has no oceans, yet the tidal forces acting on it cause the world itself to stretch and bend by an astonishing 100 meters at a time! This causes not only cracking and fissures, but also heats up the interior of the planet, the same way that rapidly bending a piece of metal back-and-forth causes it to heat up internally. When a path to the surface opens up, that internal heat escapes through quiescent lava flows and catastrophic volcanic eruptions! The hottest spots on Io's surface reach 1,200 °C (2,000 °F); compared to the average surface temperature of 110 Kelvin (-163 °C / -261 °F), Io is home to the most extreme temperature differences from location-to-location outside of the Sun.
Just by orbiting where it does, Io gets distorted, heats up, and erupts, making it the most volcanically active world in the entire Solar System! Other moons around gas giants have spectacular eruptions, too (like Enceladus around Saturn), but no world has its surface shaped by volcanic activity quite like Jupiter's innermost moon, Io!
Learn more about Galileos mission to Jupiter: http://solarsystem.nasa.gov/galileo/.
Kids can explore the many volcanoes of our solar system using the Space Places Space Volcano Explorer: http://spaceplace.nasa.gov/volcanoes.
This article was provided by the Jet Propulsion Laboratory, California Institute of Technology, under a contract with the National Aeronautics and Space Administration.
Io. Image credit: NASA / JPL-Caltech, via the Galileo spacecraft.

How To Hunt For Your Very Own Supernova!
By Dr. Ethan Siegel
In our day-to-day lives, stars seem like the most fixed and unchanging of all the night sky objects. Shining relentlessly and constantly for billions of years, it's only the long-term motion of these individual nuclear furnaces and our own motion through the cosmos that results in the most minute, barely-perceptible changes.
Unless, that is, you're talking about a star reaching the end of its life. A star like our Sun will burn through all the hydrogen in its core after approximately 10 billion years, after which the core contracts and heats up, and the heavier element helium begins to fuse. About a quarter of all stars are massive enough that they'll reach this giant stage, but the most massive ones -- only about 0.1% of all stars -- will continue to fuse leaner elements past carbon, oxygen, neon, magnesium, silicon, sulphur and all the way up to iron, cobalt, and, nickel in their core. For the rare ultra-massive stars that make it this far, their cores become so massive that they're unstable against gravitational collapse. When they run out of fuel, the core implodes.
The inrushing matter approaches the center of the star, then rebounds and bounces outwards, creating a shockwave that eventually causes what we see as a core-collapse supernova, the most common type of supernova in the Universe! These occur only a few times a century in most galaxies, but because it's the most massive, hottest, shortest-lived stars that create these core-collapse supernovae, we can increase our odds of finding one by watching the most actively star-forming galaxies very closely. Want to maximize your chances of finding one for yourself? Here's how.
Pick a galaxy in the process of a major merger, and get to know it. Learn where the foreground stars are, where the apparent bright spots are, what its distinctive features are. If a supernova occurs, it will appear first as a barely perceptible bright spot that wasn't there before, and it will quickly brighten over a few nights. If you find what appears to be a "new star" in one of these galaxies and it checks out, report it immediately; you just might have discovered a new supernova!
This is one of the few cutting-edge astronomical discoveries well-suited to amateurs; Australian Robert Evans holds the all-time record with 42 (and counting) original supernova discoveries. If you ever find one for yourself, you'll have seen an exploding star whose light traveled millions of light-years across the Universe right to you, and you'll be the very first person who's ever seen it!
Read more about the evolution and ultimate fate of the stars in our universe: http://science.nasa.gov/astrophysics/focus-areas/how-do-stars-form-and-evolve/.
While you are out looking for supernovas, kids can have a blast finding constellations using the Space Place star finder: http://spaceplace.nasa.gov/starfinder/.
This article was provided by the Jet Propulsion Laboratory, California Institute of Technology, under a contract with the National Aeronautics and Space Administration.

Caption: SN 2013ai, via its discoverer, Emmanuel Conseil, taken with the Slooh.com robotic telescope just a few days after its emergence in NGC 2207 (top); NASA, ESA and the Hubble Heritage Team (STScI) of the same interacting galaxies prior to the supernova (bottom).
Size Does Matter, But So Does Dark Energy
By Dr. Ethan Siegel
Here in our own galactic backyard, the Milky Way contains some 200-400 billion stars, and that's not even the biggest galaxy in our own local group. Andromeda (M31) is even bigger and more massive than we are, made up of around a trillion stars! When you throw in the Triangulum Galaxy (M33), the Large and Small Magellanic Clouds, and the dozens of dwarf galaxies and hundreds of globular clusters gravitationally bound to us and our nearest neighbors, our local group sure does seem impressive.
Yet that's just chicken feed compared to the largest structures in the universe. Giant clusters and superclusters of galaxies, containing thousands of times the mass of our entire local group, can be found omnidirectionally with telescope surveys. Perhaps the two most famous examples are the nearby Virgo Cluster and the somewhat more distant Coma Supercluster, the latter containing more than 3,000 galaxies. There are millions of giant clusters like this in our observable universe, and the gravitational forces at play are absolutely tremendous: there are literally quadrillions of times the mass of our Sun in these systems.
The largest superclusters line up along filaments, forming a great cosmic web of structure with huge intergalactic voids in between the galaxy-rich regions. These galaxy filaments span anywhere from hundreds of millions of light-years all the way up to more than a billion light years in length. The CfA2 Great Wall, the Sloan Great Wall, and most recently, the Huge-LQG (Large Quasar Group) are the largest known ones, with the Huge-LQG -- a group of at least 73 quasars apparently stretching nearly 4 billion light years in its longest direction: more than 5% of the observable universe! With more mass than a million Milky Way galaxies in there, this structure is a puzzle for cosmology.
You see, with the normal matter, dark matter, and dark energy in our universe, there's an upper limit to the size of gravitationally bound filaments that should form. The Huge-LQG, if real, is more than double the size of that largest predicted structure, and this could cast doubts on the core principle of cosmology: that on the largest scales, the universe is roughly uniform everywhere. But this might not pose a problem at all, thanks to an unlikely culprit: dark energy. Just as the local group is part of the Virgo Supercluster but recedes from it, and the Leo Cluster -- a large member of the Coma Supercluster -- is accelerating away from Coma, it's conceivable that the Huge-LQG isn't a single, bound structure at all, but will eventually be driven apart by dark energy. Either way, we're just a tiny drop in the vast cosmic ocean, on the outskirts of its rich, yet barely fathomable depths.
Learn about the many ways in which NASA strives to uncover the mysteries of the universe: http://science.nasa.gov/astrophysics/. Kids can make their own clusters of galaxies by checking out The Space Places fun galactic mobile activity: http://spaceplace.nasa.gov/galactic-mobile/.
This article was provided by the Jet Propulsion Laboratory, California Institute of Technology, under a contract with the National Aeronautics and Space Administration.
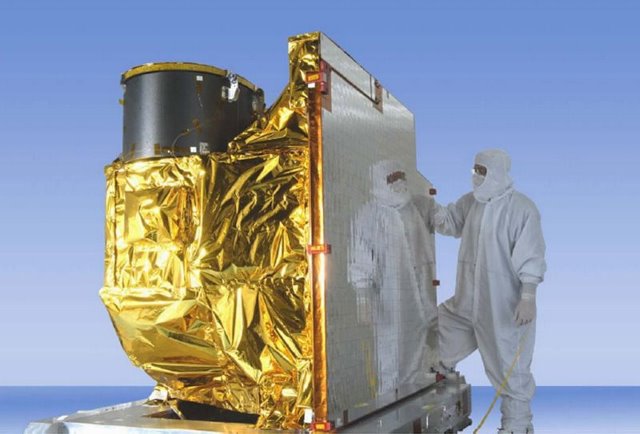
Caption: Digital mosaic of infrared light (courtesy of Spitzer) and visible light (SDSS) of the Coma Cluster, the largest member of the Coma Supercluster. Image credit: NASA / JPL-Caltech / Goddard Space Flight Center / Sloan Digital Sky Survey.
Inventing Astrophotography: Capturing Light Over Time
By Dr. Ethan Siegel
We know that its a vast Universe out there, with our Milky Way representing just one drop in a cosmic ocean filled with hundreds of billions of galaxies. Yet if youve ever looked through a telescope with your own eyes, unless that telescope was many feet in diameter, youve probably never seen a galaxys spiral structure for yourself. In fact, the very closest large galaxy to us - Andromeda, M31 - wasnt discovered to be a spiral until 1888, despite being clearly visible to the naked eye! This crucial discovery wasnt made at one of the worlds great observatories, with a world-class telescope, or even by a professional astronomer; it was made by a humble amateur to whom we all owe a great scientific debt.
Beginning in 1845, with the unveiling of Lord Rosses 6-foot (1.8 m) aperture telescope, several of the nebulae catalogued by Messier, Herschel and others were discovered to contain an internal spiral structure. The extreme light-gathering power afforded by this new telescope allowed us, for the first time, to see these hitherto undiscovered cosmic constructions. But there was another possible path to such a discovery: rather than collecting vast amounts of light through a giant aperture, you could collect it over time, through the newly developed technology of photography. During the latter half of the 19th Century, the application of photography to astronomy allowed us to better understand the Suns corona, the spectra of stars, and to discover stellar and nebulous features too faint to be seen with the human eye.
Working initially with a 7-inch refractor that was later upgraded to a 20-inch reflector, amateur astronomer Isaac Roberts pioneered a number of astrophotography techniques in the early 1880s, including piggybacking, where his camera/lens system was attached to a larger, equatorially-mounted guide scope, allowing for longer exposure times than ever before. By mounting photographic plates directly at the reflectors prime focus, he was able to completely avoid the light-loss inherent with secondary mirrors. His first photographs were displayed in 1886, showing vast extensions to the known reaches of nebulosity in the Pleiades star cluster and the Orion Nebula.
But his greatest achievement was this 1888 photograph of the Great Nebula in Andromeda, which we now know to be the first-ever photograph of another galaxy, and the first spiral ever discovered that was oriented closer to edge-on (as opposed to face-on) with respect to us. Over a century later, Andromeda looks practically identical, a testament to the tremendous scales involved when considering galaxies. If you can photograph it, youll see for yourself!
Astrophotography has come a long way, as apparent in the Space Place collection of NASA stars and galaxies posters at http://spaceplace.nasa.gov/posters /#stars.
This article was provided by the Jet Propulsion Laboratory, California Institute of Technology, under a contract with the National Aeronautics and Space Administration.

Caption: Great Nebula in Andromeda, the first-ever photograph of another galaxy. Image credit: Isaac Roberts, taken December 29, 1888, published in A Selection of Photographs of Stars, Star-clusters and Nebulae, Volume II, The Universal Press, London, 1899.
High-energy Spy
By Dr. Martin C. Weisskopf
The idea for the Chandra X-Ray Observatory was born only one year after Riccardo Giacconi discovered the first celestial X-ray source other than the Sun. In 1962, he used a sounding rocket to place the experiment above the atmosphere for a few minutes. The sounding rocket was necessary because the atmosphere blocks X-rays. If you want to look at X-ray emissions from objects like stars, galaxies, and clusters of galaxies, your instrument must get above the atmosphere.
Giacconis idea was to launch a large diameter (about 1 meter) telescope to bring X-rays to a focus. He wanted to investigate the hazy glow of X-rays that could be seen from all directions throughout the sounding rocket flight. He wanted to find out whether this glow was, in fact, made up of many point-like objects. That is, was the glow actually from millions of X-ray sources in the Universe. Except for the brightest sources from nearby neighbors, the rocket instrument could not distinguish objects within the glow.
Giacconis vision and the promise and importance of X-ray astronomy was borne out by many sounding rocket flights and, later satellite experiments, all of which provided years-, as opposed to minutes-, worth of data.
By 1980, we knew that X-ray sources exist within all classes of astronomical objects. In many cases, this discovery was completely unexpected. For example, that first source turned out to be a very small star in a binary system with a more normal star. The vast amount of energy needed to produce the X-rays was provided by gravity, which, because of the small stars mass (about equal to the Suns) and compactness (about 10 km in diameter) would accelerate particles transferred from the normal star to X-ray emitting energies. In 1962, who knew such compact stars (in this case a neutron star) even existed, much less this energy transfer mechanism?
X-ray astronomy grew in importance to the fields of astronomy and astrophysics. The National Academy of Sciences, as part of its Decadal Survey released in 1981, recommended as its number one priority for large missions an X-ray observatory along the lines that Giacconi outlined in 1963. This observatory was eventually realized as the Chandra X-Ray Observatory, which launched in 1999.
The Chandra Project is built around a high-resolution X-ray telescope capable of sharply focusing X-rays onto two different X-ray-sensitive cameras. The focusing ability is of the caliber such that one could resolve an X-ray emitting dime at a distance of about 5 kilometers!
The building of this major scientific observatory has many stories. Learn more about Chandra at http://www.science.nasa.gov/missions/chandra. Take kids on a Trip to the Land of the Magic Windows and see the universe in X-rays and other invisible wavelengths of light at http://spaceplace.nasa.gov/magic-windows.
Dr. Weisskopf is project scientist for NASA's Chandra X-ray Observatory.
This article was provided by the Jet Propulsion Laboratory, California Institute of Technology, under a contract with the National Aeronautics and Space Administration.
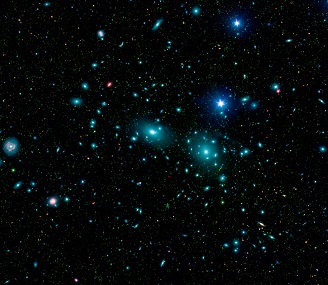
Caption: Composite image of DEM L50, a so-called superbubble found in the Large Magellanic Cloud. X-ray data from Chandra is pink, while optical data is red, green, and blue. Superbubbles are created by winds from massive stars and the shock waves produced when the stars explode as supernovas.
Triple Treat
By Dr. Ethan Siegel
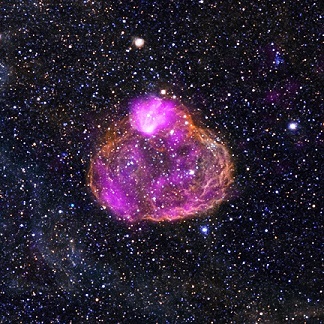
The solar system is a busy place, with five wandering planets visible to the naked eye alone. When any two pass close by each other from our point of view, we see an astronomical conjunction, but on very rare occasions, three planets will find themselves grouped together: a triple conjunction. Towards the end of May, Mercury, Venus and Jupiter will treat us to the best triple conjunction in years.
On May 25th, Mercury will pass within 1.4° of Venus, then two days later Mercury comes within 2.4° of Jupiter, and finally on the 28th, Jupiter and Venus approach within 1° of one another. If it werent for the slight orbital tilt of our solar systems planetary orbits, these conjunctions would all be occultations instead. During the nights of May 26th-27th, all three planets are visible immediately after sunset within the same 3° field of view, with the triple conjunction peaking in a triangular shape on the 26th. (For scale, the full Moon subtends about 1/2°.) The three planets appear close together for a few days more, making a line in the sky on the 30th/31st.
How does this happen? Mercury and Venus race around the Sun far faster than Earth, with Mercury completing more than four revolutions around the Sun for each one that Earth makes. At the same time, Jupiter is far slower, taking 12 years to orbit just once around the Sun. Jupiters been high in the sky during the early parts of the night, but steadily lowers throughout May as Earth continues to move away from it, approaching its maximum distance from Earth. Mercury and Venus, meanwhile, begin to move out from behind the Sun during May: Venus at the beginning of the month and Mercury in the middle.
Thus, during this triple conjunction, all three planets will be on the far side of the Sun, something that happens just 25% of the time in triple conjunctions involving Mercury and Venus! If you telescopically resolve these planets into disks, youll see our inner worlds in a nearly-full gibbous phase. Jupiter will appear largest in terms of angular diameter, followed by Venus and lastly by Mercury. Just a year ago, during its now-famous transit, Venus took up more than a full arc-minute in the sky; during this conjunction, it will just one-sixth that angular size and less than a third the apparent diameter of Jupiter. Nevertheless, Venus will still be more than six times as bright as Jupiter during this time, outshining all night-sky objects other than the Moon. Closer conjunctions of two naked-eye planets are frequent, but getting three or more like this happens just once or twice per decade, so dont miss your chance to see it.
And speaking of occultations, The Space Place has a great kid-friendly explanation of the Venus transit and solar eclipses of 2012 at http://spaceplace.nasa.gov/venus-transit.
Dr. Ethan Siegel, a theoretical astrophysicist, is a professor at the University of Portland (OR) and Lewis & Clark College.
This article was provided by the Jet Propulsion Laboratory, California Institute of Technology, under a contract with the National Aeronautics and Space Administration.
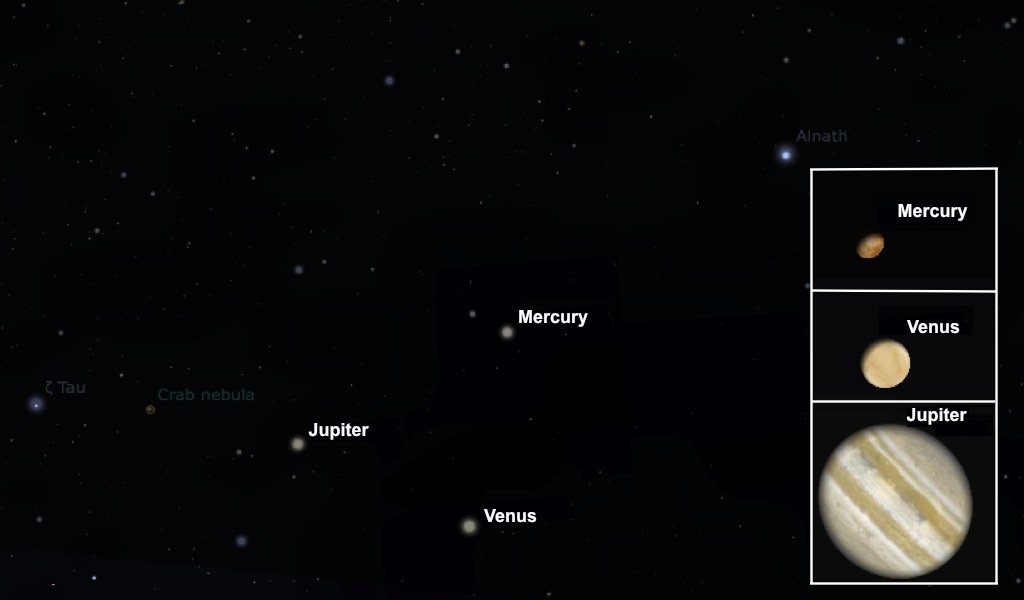
Caption: The image shows the configuration of Mercury, Venus, and Jupiter in the western sky just after sunset on May 26, 2013. Insets show the relative size appearance of the planets on that date.
Exploring the Water World
By Diane K. Fisher
In some ways, we know more about Mars, Venus and the Moon than we know about Earth. Thats because 70% of our solar systems watery blue planet is hidden under its ocean. The ocean contains about 98% of all the water on Earth. In total volume, it makes up more than 99% of the space inhabited by living creatures on the planet.
As dominant a feature as it is, the oceanat least below a few tens of meters deepis an alien world most of us seldom contemplate. But perhaps we should.
The ocean stores heat like a fly wheel for climate. Its huge capacity as a heat and water reservoir moderates the climate of Earth. Within this Earth system, both the physical and biological processes of the ocean play a key role in the water cycle, the carbon cycle, and climate variability.
This great reservoir continuously exchanges heat, moisture, and carbon with the atmosphere, driving our weather patterns and influencing the slow, subtle changes in our climate.
The study of Earth and its ocean is a big part of NASAs mission. Before satellites, the information we had about the ocean was pretty much hit or miss, with the only data collectors being ships, buoys, and instruments set adrift on the waves.
Now ocean-observing satellites measure surface topography, currents, waves, and winds. They monitor the health of phytoplankton, which live in the surface layer of the ocean and supply half the oxygen in the atmosphere. Satellites monitor the extent of Arctic sea ice so we can compare this important parameter with that of past years. Satellites also measure rainfall, the amount of sunlight reaching the sea, the temperature of the oceans surface, and even its salinity!
Using remote sensing data and computer models, scientists can now investigate how the oceans affect the evolution of weather, hurricanes, and climate. In just a few months, one satellite can collect more information about the ocean than all the ships and buoys in the world have collected over the past 100 years!
NASAs Earth Science Division has launched many missions to planet Earth. These satellites and other studies all help us understand how the atmosphere, the ocean, the land and lifeincluding humansall interact together.
Find out more about NASAs ocean studies at http://science.nasa.gov/earth-science/oceanography. Kids will have fun exploring our planet at The Space Place, http://spaceplace.nasa.gov/earth.
This article was provided by the Jet Propulsion Laboratory, California Institute of Technology, under a contract with the National Aeronautics and Space Administration.
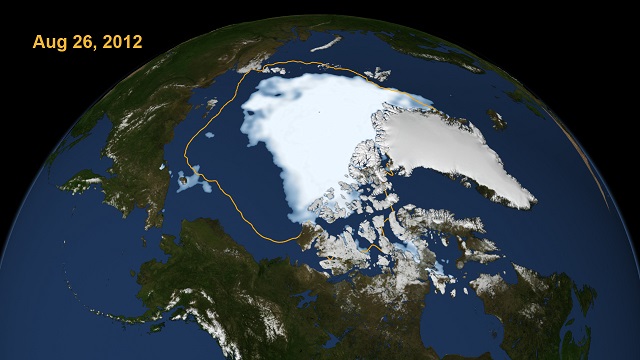
Caption: This image from September 2012, shows that the Arctic sea is the smallest recorded since record keeping began in 1979. This image is from NASAs Scientific Visualization Studio at Goddard Space Flight Center.
Your Daily Dose of Astonishment
By Diane K. Fisher
As a person vitally interested in astronomy, you probably have the Astronomy Picture of the Day website at apod.nasa.gov set as favorite link. APOD has been around since practically the beginning of the web. The first APOD appeared unannounced on June 16, 1995. It got 15 hits. The next picture appeared June 20, 1995, and the site has not taken a day off since. Now daily traffic is more like one million hits.
Obviously, someone is responsible for picking, posting, and writing the detailed descriptions for these images. Is it a whole team of people? No. Surprisingly, it is only two men, the same ones who started it and have been doing it ever since.
Robert Nemiroff and Jerry Bonnell shared an office at NASAs Goddard Space Flight Center in the early-90s, when the term World Wide Web was unknown, but a software program called Mosaic could connect to and display specially coded content on other computers. The office mates thought we should do something with this.
Thus was conceived the Astronomy Picture of the Day. Now, in addition to the wildly popular English version, over 25 mirror websites in other languages are maintained independently by volunteers. (See http://apod.nasa.gov/apod/lib/about_apod.html for links). An archive of every APOD ever published is at http://apod.nasa.gov/apod/archivepix.html. Dr. Nemiroff also maintains a discussion website at http://asterisk.apod.com/.
But how does it get done? Do these guys even have day jobs?
Dr. Nemiroff has since moved to Michigan Technological University in Houghton, Michigan, where he is professor of astrophysics, both teaching and doing research. Dr. Bonnell is still with NASA, an astrophysicist with the Compton Gamma Ray Observatory Science Support Center at Goddard. APOD is only a very small part of their responsibilities. They do not collaborate, but rather divide up the calendar, and each picks the image, writes the description, and includes the links for the days on his own list. The files are queued up for posting by a robot each day.
They use the same tools they used at the beginning: Raw HTML code written using the vi text editor in Linux. This simple format has now become such a part of the brand that they would upset all the people and websites and mobile apps that link to their feed if they were to change anything at this point.
Where do they find the images? Candidates are volunteered from large and small observatories, space telescopes (like the Hubble and Spitzer), and independent astronomers and astro-photographers. The good doctors receive ten images for every one they publish on APOD. But, as Dr. Nemiroff emphasizes, being picked or not picked is no reflection on the value of the image. Some of the selections are picked for their quirkiness. Some are videos instead of images. Some have nothing to do with astronomy at all, like the astonishing August 21, 2012, video of a replicating DNA molecule.
Among the many mobile apps taking advantage of the APOD feed is Space Place Prime, a NASA magazine that updates daily with the best of NASA. Its available free (in iOS only at this time) at the Apple Store.
This article was provided by the Jet Propulsion Laboratory, California Institute of Technology, under a contract with the National Aeronautics and Space Administration.
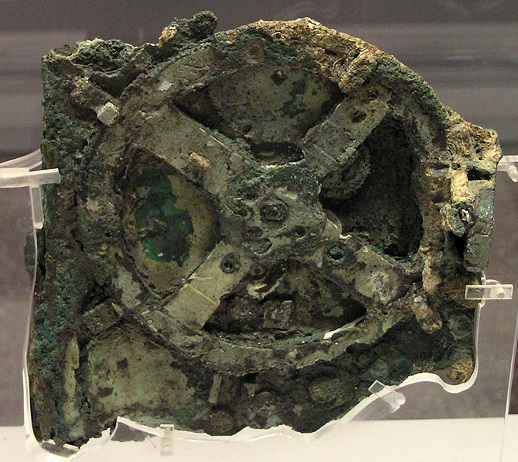
Caption: The January 20, 2013, Astronomy Picture of the Day is one that might fall into the quirky category. The object was found at the bottom of the sea aboard a Greek ship that sank in 80 BCE. It is an Antikythera mechanism, a mechanical computer of an accuracy thought impossible for that era. Its wheels and gears create a portable orrery of the sky that predicts star and planet locations as well as lunar and solar eclipses.
Tackling the Really BIG Questions
By Diane K. Fisher
How does NASA get its ideas for new astronomy and astrophysics missions? It starts with a Decadal Survey by the National Research Council, sponsored by NASA, the National Science Foundation, and the Department of Energy. The last one, New Worlds, New Horizons in Astronomy and Astrophysics was completed in 2010. It defines the highest-priority research activities in the next decade for astronomy and astrophysics that will set the nation firmly on the path to answering profound questions about the cosmos. It defines space- and ground-based research activities in the large, midsize, and small budget categories.
The recommended activities are meant to advance three science objectives: 1. Deepening understanding of how the first stars, galaxies, and black holes formed 2. Locating the closest habitable Earth-like planets beyond the solar system for detailed study, and 3. Using astronomical measurements to unravel the mysteries of gravity and probe fundamental physics.
For the 2012-2021 period, the highest-priority large mission recommended is the Wide-field Infrared Survey Telescope (WFIRST). It would orbit the second Lagrange point and perform wide-field imaging and slitless spectroscopic surveys of the near-infrared sky for the community. It would settle essential questions in both exoplanet and dark energy research and would advance topics ranging from galaxy evolution to the study of objects within the galaxy and within the solar system.
Naturally, NASAs strategic response to the recommendations in the decadal survey must take budget constraints and uncertainties into account.
The goal is to begin building this mission in 2017, after the launch of the James Webb Space Telescope. But this timeframe is not assured. Alternatively, a different, less ambitious mission that also addresses the Decadal Survey science objectives for WFIRST would remain a high priority.
The Astrophysics Division is also doing studies of moderate-sized missions, including: gravitational wave mission concepts that would advance some or all of the science objectives of the Laser Interferometer Space Antenna (LISA), but at lower cost; X-ray mission concepts to advance the science objectives of the International X-ray Observatory (IXO), but at lower cost; and mission concept studies of probe-class missions to advance the science of a planet characterization and imaging mission.
For a summary of NASAs plans for seeking answers to the big astrophysics questions and to read the complete Astrophysics Implementation Plan (dated December 2012), see http://science.nasa.gov/astrophysics/. For kids, find lots of astrophysics fun facts and games on The Space Place, http://spaceplace.nasa.gov/menu/space/.
This article was provided by the Jet Propulsion Laboratory, California Institute of Technology, under a contract with the National Aeronautics and Space Administration.
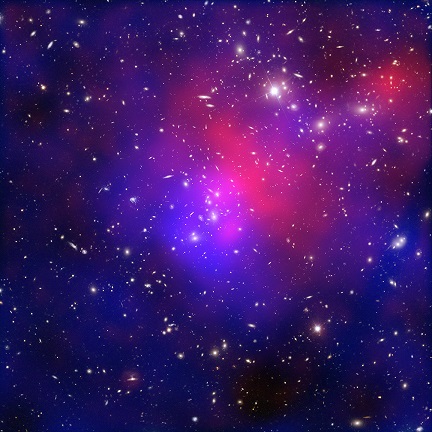
Caption: Clusters of galaxies collide in this composite image of Pandora's Cluster. Data (in red) from NASA's Chandra X-ray Observatory show gas with temperatures of millions of degrees. Blue maps the total mass concentration (mostly dark matter) based on data from the Hubble Space Telescope (HST), the European Southern Observatory's Very Large Telescope (VLT), and the Japanese Subaru telescope. Optical data from HST and VLT also show the constituent galaxies of the clusters. Such images begin to reveal the relationship between concentration of dark matter and the overall structure of the universe.
The Art of Space Imagery
By Diane K. Fisher
When you see spectacular space images taken in infrared light by the Spitzer Space Telescope and other non-visible-light telescopes, you may wonder where those beautiful colors came from? After all, if the telescopes were recording infrared or ultraviolet light, we wouldnt see anything at all. So are the images colorized or false colored?
No, not really. The colors are translated. Just as a foreign language can be translated into our native language, an image made with light that falls outside the range of our seeing can be translated into colors we can see. Scientists process these images so they can not only see them, but they can also tease out all sorts of information the light can reveal. For example, wisely done color translation can reveal relative temperatures of stars, dust, and gas in the images, and show fine structural details of galaxies and nebulae.
Spitzers Infrared Array Camera (IRAC), for example, is a four-channel camera, meaning that it has four different detector arrays, each measuring light at one particular wavelength. Each image from each detector array resembles a grayscale image, because the entire detector array is responding to only one wavelength of light. However, the relative brightness will vary across the array.
So, starting with one detector array, the first step is to determine what is the brightest thing and the darkest thing in the image. Software is used to pick out this dynamic range and to re-compute the value of each pixel. This process produces a grey-scale image. At the end of this process, for Spitzer, we will have four grayscale images, one for each for the four IRAC detectors.
Matter of different temperatures emit different wavelengths of light. A cool object emits longer wavelengths (lower energies) of light than a warmer object. So, for each scene, we will see four grayscale images, each of them different.
Normally, the three primary colors are assigned to these gray-scale images based on the order they appear in the spectrum, with blue assigned to the shortest wavelength, and red to the longest. In the case of Spitzer, with four wavelengths to represent, a secondary color is chosen, such as yellow. So images that combine all four of the IRACs infrared detectors are remapped into red, yellow, green, and blue wavelengths in the visible part of the spectrum.
Download a new Spitzer poster of the center of the Milky Way. On the back is a more complete and colorfully-illustrated explanation of the art of space imagery. Go to http://spaceplace.nasa.gov/posters/#milky-way.
This article was provided by the Jet Propulsion Laboratory, California Institute of Technology, under a contract with the National Aeronautics and Space Administration.

Caption: This image of M101 combines images from four different telescopes, each detecting a different part of the spectrum. Red indicates infrared information from Spitzers 24-micron detector, and shows the cool dust in the galaxy. Yellow shows the visible starlight from the Hubble telescope. Cyan is ultraviolet light from the Galaxy Evolution Explorer space telescope, which shows the hottest and youngest stars. And magenta is X-ray energy detected by the Chandra X-ray Observatory, indicating incredibly hot activity, like accretion around black holes.